As we continue looking at program metrics in Golang, it is time to look at performance matrics analysis.
Instrumentation
Instrumentation is the process of adding code to your application to generate events to allow you to monitor application health and performance. Instrumentation allows you to profile applications. Profiling enables you to identify how long a particular method or operation takes to run and how efficient it is in terms of CPU and memory resource usage. Collect custom data. This might include custom performance counters that you use to monitor application-specific activity, such as how long it takes to place an order. Trace code. This allows you to understand the application code path and all the methods run for a particular use case.
In this artcile, we will explore how to use the
pprof package and tool to profile
Golang applications.
You should import net/http/pprof to expose the application profile via HTTP.
import _ "net/http/pprof"
If you don’t run an HTTP server, you should the following code snippet to make available an HTTP endpoint:
http.ListenAndServe(":8080", http.DefaultServeMux)
The packages registers a set of http handlers as part of the /debug/pprof
endpoint into the default http mux that allows pprof tool to retrieve any
infromation about the different application profiles:
- Memory profile (http://localhost:8080/debug/pprof/heap)
- CPU profile (http://localhost:6060/debug/pprof/profile)
- Goroutine blocking profile (http://localhost:6060/debug/pprof/block)
Then use the pprof tool to look at query and read the profiles by executing go tool pprof command.
HEAP Profile
The HEAP profile can be useful for:
- Figuring out what is in the program heap at any given time
- Locating memory leaks
- Finding places that do a lot of allocation
By using top command you can see the top functions that take most of the heap
memory.
$ go tool pprof http://localhost:8080/debug/pprof/heap

Fetching profile from http://127.0.0.1:8080/debug/pprof/heap
Saved profile in /Users/iamralch/pprof/pprof.127.0.0.1:8080.inuse_objects.inuse_space.005.pb.gz
Entering interactive mode (type "help" for commands)
(pprof) top
512.19kB of 512.19kB total (  100%)
      flat  flat%   sum%        cum   cum%
  512.19kB   100%   100%   512.19kB   100%  runtime.malg
         0     0%   100%   512.19kB   100%  runtime.mcommoninit
         0     0%   100%   512.19kB   100%  runtime.mpreinit
         0     0%   100%   512.19kB   100%  runtime.rt0_go
         0     0%   100%   512.19kB   100%  runtime.schedinit
CPU Profile
The CPU profiler helps finds a performance bottlenecks of given
application. You could read ana analyse the profile by executing go tool pprof
command. By default it is sampling the application performance for 30 seconds.
The Go program stops about 100 times per second and records a sample consisting
of the program counters on the currently executing goroutine’s stack:
$ go tool pprof http://localhost:8080/debug/pprof/profile
Fetching profile from http://127.0.0.1:8080/debug/pprof/profile
Please wait... (30s)
Saved profile in /Users/iamralch/pprof/pprof.127.0.0.1:8080.samples.cpu.004.pb.gz
Entering interactive mode (type "help" for commands)
(pprof)
Custom profile
If you want to create your own cutom profiler, you should use pprof.Profile
object:
import (
	"net/http"
	pprofHTTP "net/http/pprof"
	"runtime/pprof"
)

var paymentProfile *pprof.Profile

func init() {
	paymentProfile = pprof.NewProfile("payment")
	http.DefaultServeMux.Handle("/debug/pprof/payment", pprofHTTP.Handler("payment"))
}
The named profile could be create by executing pprof.NewProfile constructor
function. In addition the net/http/pprof packages provides a Handler
function that register a handler for a particular profile by name.
Then you can add/remove the profile sampling data with the following code snippet:
payment := &Payment{
	Payee:  "John Doe",
	Amount: 128.54}

skip := 0

paymentProfile.Add(payment, skip)
ProcessPayment(ctx, payment)
paymentProfile.Remove(payment)
The Add function accepts two arguments:
valuea sampling data associated with the profileskipdefines when the profile should begin the trace in the function callingAdd.
Lets retrive the profile and explore the difference:
$ go tool pprof http://127.0.0.1:8080/debug/pprof/payment
Fetching profile from http://127.0.0.1:8080/debug/pprof/payment
Saved profile in /Users/iamralch/pprof/pprof.127.0.0.1:8080.payment.008.pb.gz
Entering interactive mode (type "help" for commands)
(pprof) top
Passing skip=0 begins the stack trace at the call to Add before ProcessPayment:
1 of 1 total (  100%)
      flat  flat%   sum%        cum   cum%
         1   100%   100%          1   100%  runtime/pprof.(*Profile).Add
         0     0%   100%          1   100%  main.main
         0     0%   100%          1   100%  runtime.goexit
         0     0%   100%          1   100%  runtime.main
Passing skip=1 begins the stack trace at the call to Add inside ProcessPayment:
1 of 1 total (  100%)
      flat  flat%   sum%        cum   cum%
         1   100%   100%          1   100%  main.main
         0     0%   100%          1   100%  runtime.goexit
         0     0%   100%          1   100%  runtime.main
The sample application can be found here.
Generating reports
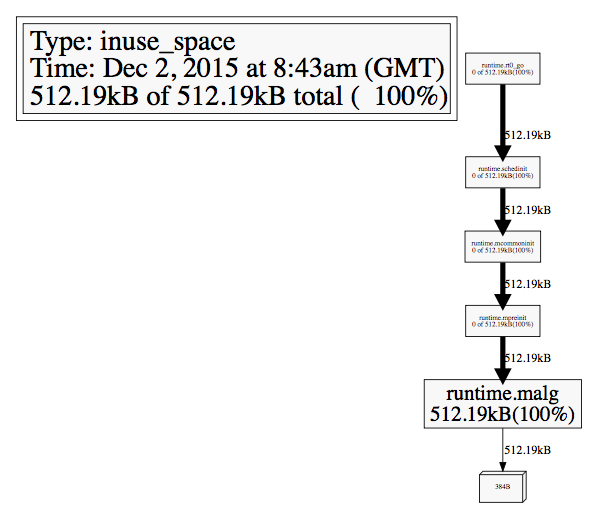
The pprof tool even provides a nice way to visualise the program profile in
svg diagram. You should execute web command as part of pprof tool:
Fetching profile from http://127.0.0.1:8080/debug/pprof/heap
Saved profile in /Users/iamralch/pprof/pprof.127.0.0.1:8080.inuse_objects.inuse_space.005.pb.gz
Entering interactive mode (type "help" for commands)
(pprof) web
Conclusion
It’s never been so easy to profile our programs. Golang is designed for distributed
environment. Therefore profiling and metrics analysis are comming as part of
the language runtime.