In my previous post I demonstrated how you can debug
golang applications with LLDB. In this article I will illustrate
the most recent debugger for Go: Delve
The debugger is a community effort to bring a debugger in the toolchain of every Go developer.
It’s written in Go to debug Go code. It’s still in active development, but
we can still benefit from its basic features.
Installation
You should install Delve with the following command:
$ go get -u github.com/derekparker/delve/cmd/dlv
Note that you need at least Go 1.4.
Installation: Linux
In Linux you should NOT do anything else further. You are ready.
Installation: MacOSX
If you are using MacOSX as me, you need a self-signed certificate to sign the delve binary.
You should create a new certificate by using application “Keychain Access”.
Choose a certificate name, set “Identity Type” to “Self Signed Root”, set “Certificate Type” to
Code Signingand select theLet me override defaults: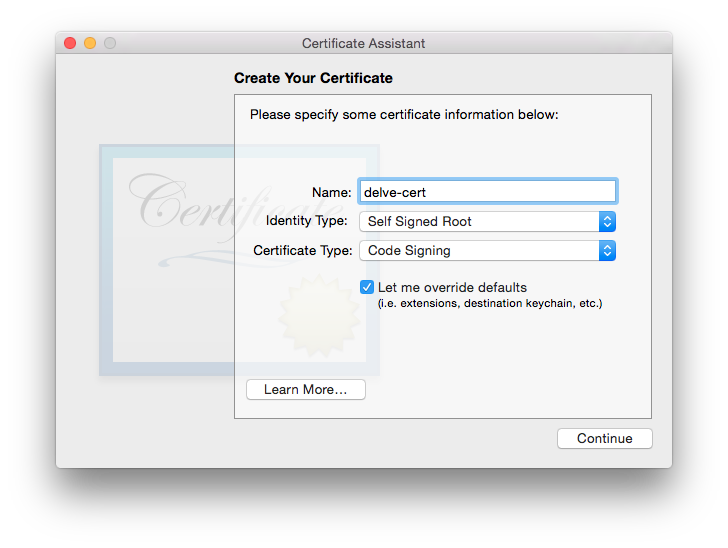
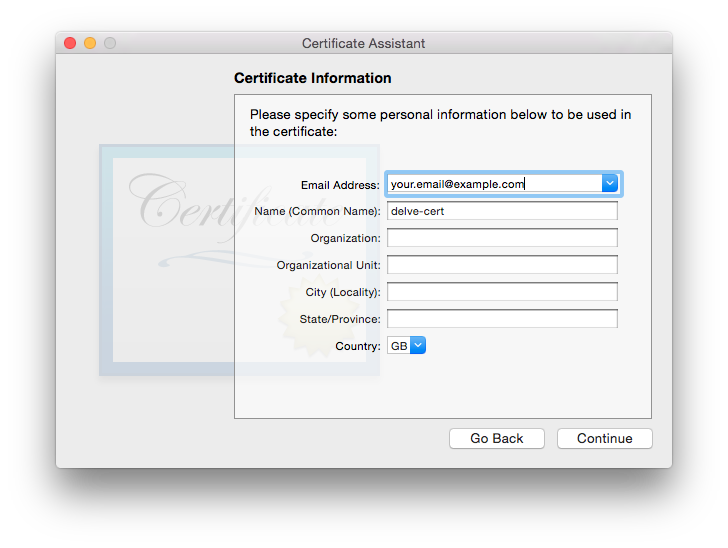
Continue to a certificate information wizard step. If you email address is missing, please fill the required field:
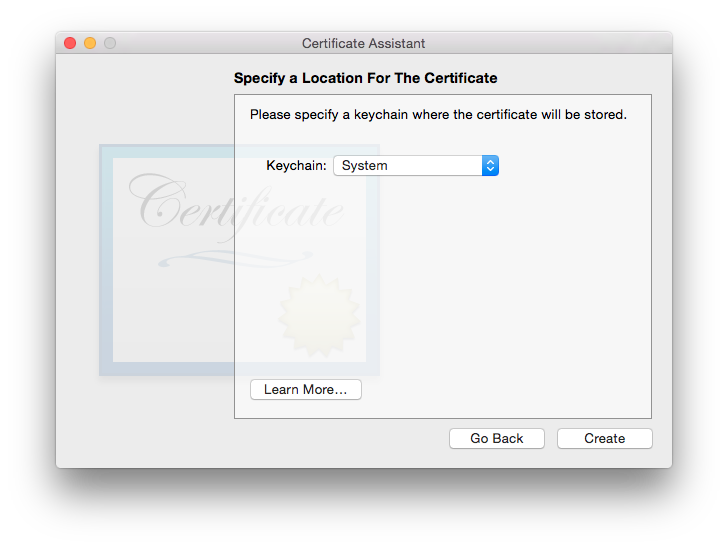
Click several times on “Continue” until you get to the “Specify a Location For The Certificate” screen, then set “Keychain to System”.
Then we need sign the binary by using the created certificate. In order to do that we should execute the following command:
# CERT=<your_ceriticate_name> make install
If you need more detailed guidelines, you should follow the official documentation.
You can watch the following video that demonstrates the installation process:
Integration
Right now the debugger does not have integration with any IDE. Nevertheless, the contributors
are working hard to release an API interface that will allow that. For now Delve can
be started from a command line.
Getting started
Compile, run, and attach in one step:
$ dlv run
Run program with tracepoints set at functions matching [regexp]:
$ dlv trace [regexp]
Compile test binary, start and attach:
$ dlv test
Provide the application path you want to debug:
$ dlv path/to/program
Provide the running application process id:
$ sudo dlv attach 47478
Delve will pass any arguments after dlv run|test|trace to the newly created process:
$ dlv run -- -http=:6060
$ dlv run arg1 -- -flag1 -flag2
Commands
In debug session, you can use the following commands:
help- Prints the help message.restart- Restarts the process, killing the current one if it is running.break (break <address> [-stack <n>|-goroutine|<variable name>]*)- Set a breakpoint. Example:break foo.go:13orbreak main.main.trace- Set a tracepoint. Syntax identical to breakpoints.continue- Run until breakpoint or program termination.step- Single step through program.next- Step over to next source line.threads- Print status of all traced threads.thread $tid- Switch to another thread.goroutines- Print status of all goroutines.breakpoints- Print information on all active breakpoints.print $var- Evaluate a variable.info $type [regex]- Outputs information about the symbol table. An optional regex filters the list. Exampleinfo funcs unicode. Valid types are:args- Prints the name and value of all arguments to the current functionfuncs- Prints the name of all defined functionslocals- Prints the name and value of all local variables in the current contextsources- Prints the path of all source filesvars- Prints the name and value of all package variables in the app. Any variable that is not local or arg is considered a package variablesregs- Prints the contents of CPU registers.
stack [ <depth> [ <goroutine id> ] ]- Prints the stacktrace of the current goroutine, up to<depth>.<depth>defaults to 10, pass a second argument to print the stacktrace of a different goroutine.exit- Exit the debugger.
Demo
In the demo video, I am using the same application that I debugged in the LLDB article.
Note that parts of this article are taken from the official Delve
commands documentation and
usage documentation.